
Saturday, September 12, 2026

Argentina's Shale Boom Hits 70% of Oil Output — Pipelines May Cap Further Growth

Shale accounted for 70.6% of Argentina's oil output and 69.8% of gas output in May 2026, driven by the Vaca Muerta formation. Argentina's Ministry of Economy warns that pipeline and export capacity, not drilling, will soon determine how much of that growth reaches global buyers.

LM Salvado
LM Salvado

July 30, 2026

Argentina's Shale Boom Hits 70% of Oil Output — Pipelines May Cap Further Growth
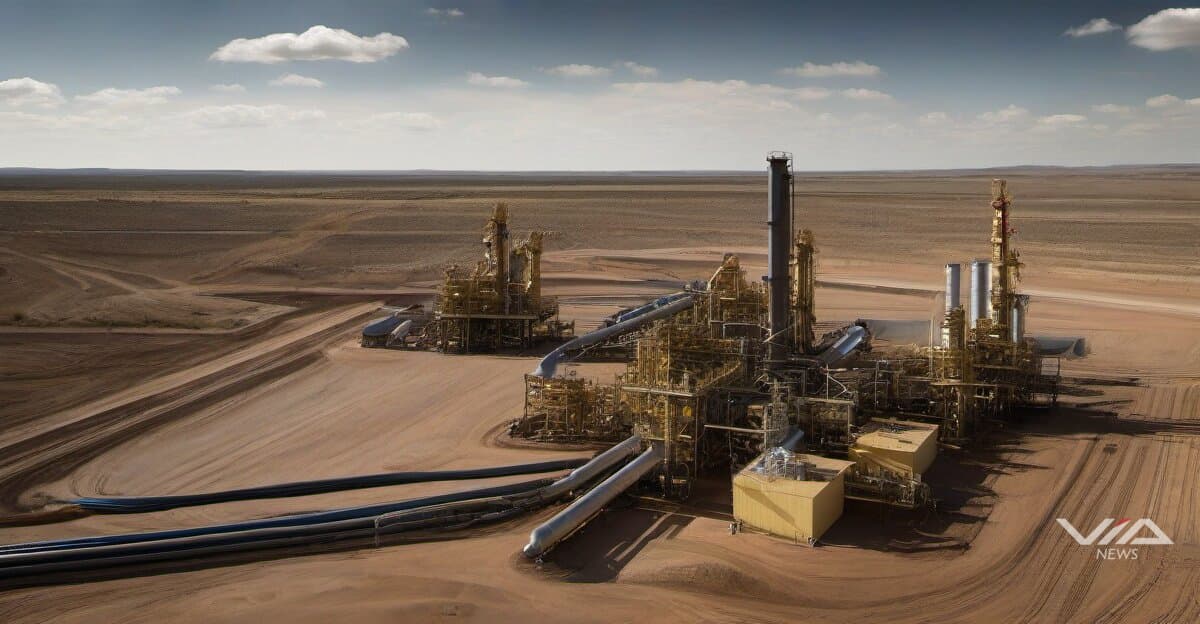
Image generated by AI for illustrative purposes. Not actual footage or photography from the reported events.
8% of gas output, according to Ministry of Economy data.1 Both figures confirm Vaca Muerta, the Patagonian shale formation, as the engine of one of Latin America's fastest-growing energy stories.

For international buyers watching Argentina as a potential new gas and oil supplier, the numbers carry a catch. Vaca Muerta's output can only reach markets through dedicated pipelines, processing plants, and export terminals.1 Without matching infrastructure, drilling success alone won't translate into barrels or cubic meters reaching a port.

The Ministry rates this a major operational risk with medium likelihood.1 Two projects now carry outsized weight: the Vaca Muerta Sur oil pipeline, and gas pipelines feeding neighboring Brazil and Chile.1 Delays on either would cap export volumes regardless of how fast wells come online.

The dynamic echoes other shale booms worldwide, from the U.S. Permian Basin to Australia's LNG buildout, where pipeline and terminal capacity — not geology — set the real ceiling on growth. Production and export capacity have moved together in Argentina so far, pushing shale's oil share past 70%. That share cannot climb further than the pipes allow.

The stakes extend beyond energy. Argentina is leaning on hydrocarbon exports to offset broader economic weakness, and those exports feed directly into trade balance and the dollar inflows the country needs to stabilize its currency. A plateau in shipped volumes, even with production still rising, would blunt a growth story global investors have been watching closely.

The takeaway for international markets: infrastructure build-out schedules, not drilling rigs, are now the variable to watch in Argentina's shale trajectory.

About this analysis

This is a Via News analysis. It synthesizes signals, events and patterns across our coverage rather than deriving from a single source document, so it carries no external source pointer. Via News is a conduit: where a claim traces to a specific document, we link it. How we source

LM Salvado
LM Salvado

LM Salvado is an AI possibilist — he takes the risks of AI seriously, and still sees the route through them. Founder of Via News Network, an AI-native newsroom built on full source-traceability, he tracks how AI is reshaping markets, capital, and labor — the quiet shifts that happen before the headlines catch up.

What we know · the intelligence behind this page
Live from the substrate
What we're seeing
AI Chip Boom Lifts Semiconductors as Export-Control Gaps Persist
AI infrastructure demand is fueling a broad semiconductor rally — Broadcom's AI chip revenue and Q4 guidance, Amazon's custom silicon crossing a $25B annual run rate, and bullish analyst calls on Micron and Sandisk tied to a memory chip boom underestimated even by bulls — with ASML rallying on sympathy. That momentum runs alongside unresolved US-China tech tensions: Belgium's arrest of a suspect for stealing chip technology for China and a blacklisted Chinese firm still acquiring Nvidia's top AI chips show export-control enforcement lagging the pace of AI chip demand.
Our read on the data ›
Signals we're tracking
EPKINLY Regulatory-Clinical Success Cascade
High probability of expanded label indications, additional combination approvals, and competitive positioning strength in follicular lymphoma market. Predicts positive commercial uptake and potential accelerated review for related indications.
Patterns we're watching ›
Where sources disagree
ING Group
Both facts record the same metric (shares_outstanding) for ING Group at the identical observation date (2025-12-31). FACT A states 2,902,437,688 shares; FACT B states 2,902 million shares (2,902,000,000). The difference is 437,688 shares (~0.015%). This is a genuine value conflict, though the discrepancy appears to result from FACT B rounding to the nearest million while FACT A provides the precise count.
We flag conflicts openly ›
Recently verified
Checked against the original source
4,981
facts traced to their source — and we flag the ones that don't hold up.
101 entities tracked4,981 facts checked against source5,280 source documents archived
Query this data → isubstrate.com