
Saturday, August 15, 2026
What we know · the intelligence behind this page
Live from the substrate
What we're seeing
AI Platforms Move to Shore Up Trust as Leadership Shifts and AI-Adjacent Markets Wobble
Major AI and media platforms are converging on trust and accountability measures — Anthropic's Claude adding watermarks, Spotify labeling AI artists — just as OpenAI loses special-projects lead Brad Lightcap and Meta's Zuckerberg publishes a defensive manifesto on AI's societal role. In parallel, AI-adjacent financial dynamics are surfacing real stress: Wall Street firms are paying for privileged early access to Trump's Truth Social posts for trading edge, while Trump Media itself reports a $238M loss driven by falling crypto holdings, highlighting how information asymmetry and speculative digital assets are becoming entangled with AI-era platforms.
Our read on the data ›
Signals we're tracking
Satellite-Terrestrial Network Integration Acceleration
Increased investment and launches in hybrid satellite-cellular networks across telecom industry; competitive responses from other carriers; regulatory activity around satellite spectrum; expansion of emergency/rural connectivity use cases
Patterns we're watching ›
Where sources disagree
JPMorgan Chase & Co.
Both facts report JPMorgan Chase & Co.'s revenue for the same fiscal period (FY 2025) with the same observation date (2025-12-31), but with different values: $182.447 billion vs. $185 billion. The ~1.4% difference ($2.553 billion) is too large to be explained by rounding alone and represents conflicting data for the identical time period.
We flag conflicts openly ›
Recently verified
Checked against the original source
4,805
facts traced to their source — and we flag the ones that don't hold up.
101 entities tracked4,805 facts checked against source5,200 source documents archived
Work with this data → vianewsagency.com

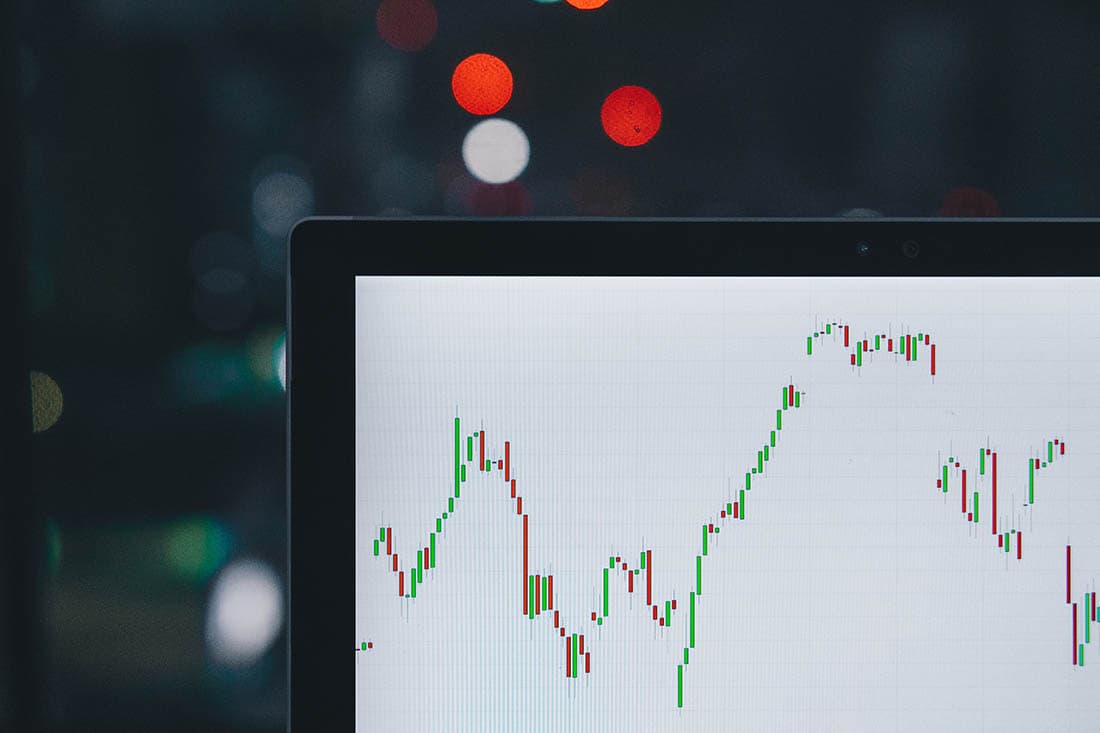
S&P 500 Over 4% Up In The Last 14 Days

S&P 500 Over 4% Up In The Last 14 Days

S&P 500 is currently on bullish momentum. At 14:08 EST on Friday, 9 April, S&P 500 is at 4,110.84, 4.62% up since the last session's close.

S&P 500 Range

About S&P 500's daily highs and lows, it's 5.7% up from its trailing 14 days low of $3,889.07 and 0.31% up from its trailing 14 days high of $4,098.19.

About S&P 500's yearly highs and lows, it's 0.37% up from its 52-week low and 0.03% down from its 52-week high.

Index Price Classification

According to the stochastic oscillator, a useful indicator of overbought and oversold conditions, S&P 500's is considered to be oversold (<=20).

ViaNews Editorial Team

Via News Editorial Team delivers comprehensive financial news coverage and market analysis from journalists around the world. Our team specializes in data journalism and in-depth reporting on stock markets, business developments, and economic trends.