

The Global Support Activities for Mining Industry is integral to the optimal functioning of the global economy. The industry engages in activities that facilitate the operation of mining companies. The industry gets divided into three markets: support activities for the metal mining sector, the non-metallic mining sector, and the coal mining sector. Therefore, the industry has many moving parts and a sectoral analysis may bring out different results from the broad industry.
In some sense, the support activities for the mining industry are a subcategory of the mining industry. This means the state of the global mining industry determines the state of the support activities sector.
In the decade after the Great Recession, the Global Support Activities for Mining Industry has been expanding on the back of favorable conditions in the broad mining industry.
Many companies that operate in the support activities sector of the mining industry offer their services on a contractual basis. While some companies offer financial support, others offer mining equipment.
Interestingly, the global mining equipment market is growing fast in value. In 2017, the market was worth $106.9 billion. With a CAGR of more than 7.2%, the market was worth approximately $122.31 billion at the end of 2019. Most of the mining equipment comes from companies like Komatsu, Caterpillar, and Liebherr-International AG.
2019 was a good year for mining companies. The top 40 mining companies in the world recorded an 8% jump in revenue to $683 billion, according to figures by PricewaterhouseCoopers (PwC). PwC showed that capital expenditure by mining companies increased by 12% to $57 billion, the first such increase in five years. Also, the production of minerals (metals, nonmetals, and coal) was at 17.2 billion metric tons, according to the World Mining Congress data.
Countries where support activities for the mining industry flourish
Oftentimes, the Support Activities for the Mining Industry sector are robust in countries with a strong mining industry. The United States is one of these countries. In 2018, the output from US mines amounted to $82.2 billion in value. Comparatively, it was 3% higher than the total output for the previous year, according to the US Geological Survey’s Mineral Commodities Summaries.
Interestingly, the support activities for mining in the US ebbs and flows in accord with the mining industry. The support activities for mining experience higher gross operating surplus during the years when the mining industry is doing well.
As the chart below shows, the operating surplus was low between 2008 and 2011. During this period, the global economy was in turmoil, and industries, among them mining, were underperforming.
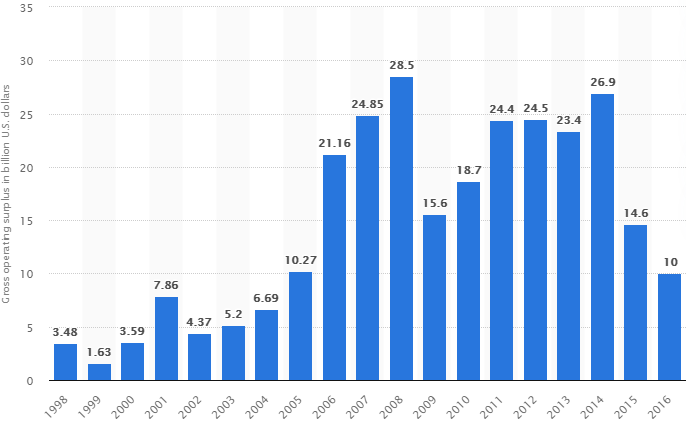
The other country where the support activities for mining are robust is Australia. As of 2019, the sector had achieved a market value of over AUD 10 billion. There were 1,823 businesses providing support services like mineral exploration. Over 41,000 Australians worked in the industry.
Best performing sectors
The best performing sectors in this industry include equipment selling and maintenance, mineral exploration, and oil and gas mining.
Halliburton, for example, is a multinational company that participates in support activities for oil and gas mining. The company has more than 55,000 people on its payroll spread across 140 countries. Specifically, Halliburton facilitates hydrocarbon exploration and management of geological data.
Other companies like CIMIC Group Limited offer a range of services targeted at mining companies. CIMIC Group develops mining equipment that is in use all over the world. The company offers maintenance services for the equipment.
Short-term and long-term expectations
In the short-term, the industry is facing various challenges. They include a slowdown in the economic growth of China, which is also the largest importer of minerals and other raw materials from mines. This disappointment will get worse as China and the world continue to grapple with the coronavirus epidemic. Secondly, increased global tensions are weighing on the growth of the global economy. As such, the demand for minerals and raw materials remains low.
The long-term outlook is rosy. Particularly, copper and metal prices will stabilize in the long-term while growth is expected to will pick up. Furthermore, China has plans in motion to spur economic growth and the resulting demand for minerals should fuel demand for supporting activities.