
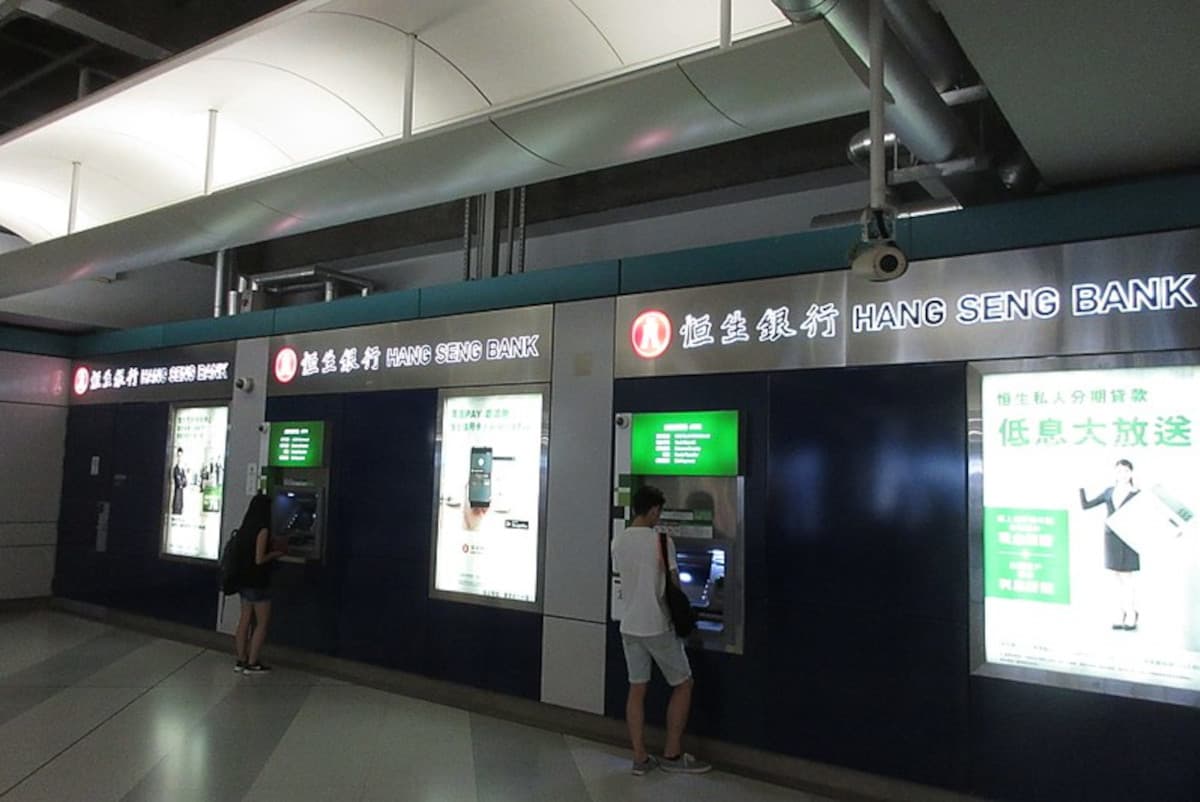
(VIANEWS) - HANG SENG INDEX (HSI) has been up by 2.65% for the last session's close. At 22:08 EST on Monday, 2 October, HANG SENG INDEX (HSI) is $17,337.26.
HANG SENG INDEX Range
About HANG SENG INDEX's daily highs and lows, it's 0.83% down from its trailing 24 hours low of $17,482.40 and 3.33% down from its trailing 24 hours high of $17,935.20.
Concerning HANG SENG INDEX's yearly highs and lows, it's 18.77% up from its 52-week low and 23.63% down from its 52-week high.
Volatility
HANG SENG INDEX's last week, last month's, and last quarter's current intraday variation average was a positive 0.66%, a negative 0.17%, and a positive 1.14%, respectively.
HANG SENG INDEX's highest amplitude of average volatility was 1.57% (last week), 1.16% (last month), and 1.14% (last quarter), respectively.
Index Price Classification
According to the stochastic oscillator, a useful indicator of overbought and oversold conditions, HANG SENG INDEX's is considered to be oversold (<=20).
News about
- According to DailyForex on Monday, 2 October, "The S&P 500 initially tried to rally during the trading session on Friday, as traders probably were anticipating the "end of month market." Having said that, later in the day we started to see a lot of selling pressure, and that could cause quite a bit of panic at this point. ", "Ultimately, this is a situation where traders will continue to look at this through the prism of race, and risk is just far too out-of-control now right now to get overly comfortable holding the S&P 500 for a significant amount of time. "
- According to MarketWatch on Monday, 2 October, "The stock was slightly lower premarket and is down 11.7% in the year to date, while the S&P 500 SPX has gained 11.7%."
- According to MarketWatch on Monday, 2 October, "The stock has climbed 12.8% over the past three months through Friday, while the S&P 500 has lost 3.7%."
- According to MarketWatch on Monday, 2 October, "The Magnificent Seven trade at 1.3 times their PEG ratio (price-to-EPS-to-long-term growth), versus 1.9 for the median S&P 500 stock. ", "In the upcoming third-quarter earnings season, the largest tech companies are expected to register 11% sales growth, compared to just 1% for the S&P 500 as a whole. "
- According to MarketWatch on Monday, 2 October, "But...theprice level of the S&P 500 is approaching an area of attractive risk/reward," wrote Lee in a note.", "It follows a tough September, when the S&P 500 endured its worst month of the year, down 4.9%, as 10-year Treasury yields surged to their highest level since 2007 amid concerns sticky inflationary pressures would cause the Federal Reserve to keep interest rates higher for longer."
More news about HANG SENG INDEX (HSI).