
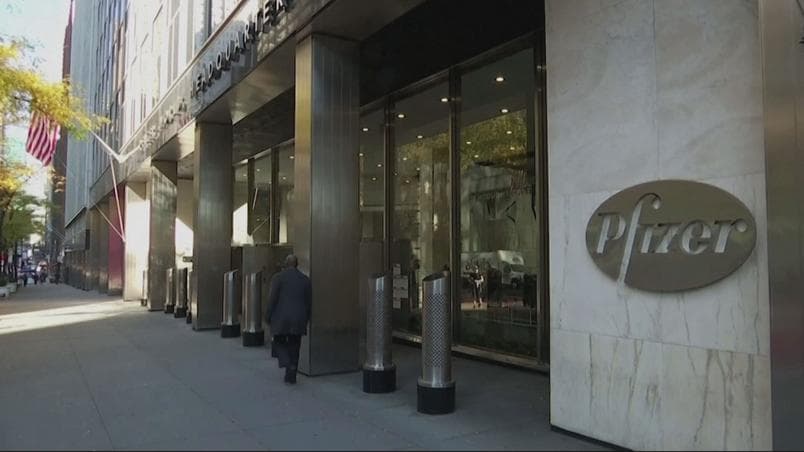
(VIANEWS) - Pfizer (PFE), Omnicell (OMCL), Mercer International (MERC) are the highest sales growth and return on equity stocks on this list.
Here is a list of stocks with an above 5% expected next quarter sales growth, and a 3% or higher return on equity. May these stocks be a good medium-term investment option?
1. Pfizer (PFE)
108.8% sales growth and 14.03% return on equity
Pfizer Inc. develops, manufactures, and sells healthcare products worldwide.
Pfizer's sales growth this year is expected to be 91.3% and a negative 12.9% for next year.
Year-on-year quarterly revenue growth grew by 44.6%, now sitting on 46.41B for the twelve trailing months.
Volume
Today's last reported volume for Pfizer is 27217600 which is 19.74% below its average volume of 33915400.
Pfizer's sales growth for the next quarter is 108.8%. The company's growth estimates for the ongoing quarter and the next is 50% and 150%. The company's return on equity, which measures the profitability of a business relative to shareholder's equity, for the twelve trailing months is 14.03%.
Volatility
Pfizer's last day, last week, and last month's current intraday variation average was 0.90%, 2.55%, and 1.96%, respectively.
Pfizer's highest amplitude of average volatility was 1.86% (day), 3.15% (last week), and 2.67% (last month), respectively.
Pfizer's Stock Yearly Top and Bottom Value
Pfizer's stock is valued at $49.60 at 05:22 EST, below its 52-week high of $51.86 and way above its 52-week low of $33.36.
Pfizer's Moving Average
Pfizer's value is way above its 50-day moving average of $43.57 and way above its 200-day moving average of $42.49.Previous days news about Pfizer(PFE)
- According to The New York Times on Friday, 12 November, "Representatives of major advertising agencies, industry trade groups and companies including Ford Motor, L'Oreal and Pfizer are expected to attend. "
- According to Bloomberg Quint on Friday, 12 November, "In pharmaceuticals, J&J's European peers stole a march: GlaxoSmithKline Plc is working on a spinoff of its own mammoth consumer business (a joint venture with Pfizer Inc.), while Novartis AG has been gradually hiving off units -including a stake last weekin rival Roche Holding AG - that weren't core to its scientific mission."
2. Omnicell (OMCL)
21.7% sales growth and 7.91% return on equity
Omnicell, Inc., together with its subsidiaries, provides medication management automation solutions and adherence tools for healthcare systems and pharmacies the United States and internationally.
Omnicell's sales growth this year is anticipated to be 24.6% and 13.9% for next year.
Year-on-year quarterly revenue growth grew by 38.7%, now sitting on 1.07B for the twelve trailing months.
Volume
Today's last reported volume for Omnicell is 103242 which is 57.68% below its average volume of 243993.
Omnicell's sales growth for the next quarter is 21.7%. The company's growth estimates for the current quarter and the next is 51.7% and 9.9%. The company's return on equity, which measures the profitability of a business relative to shareholder's equity, for the twelve trailing months is 7.91%.
Volatility
Omnicell's last day, last week, and last month's current intraday variation average was 0.17%, 1.00%, and 1.27%, respectively.
Omnicell's highest amplitude of average volatility was 1.87% (day), 2.34% (last week), and 3.01% (last month), respectively.
Omnicell's Stock Yearly Top and Bottom Value
Omnicell's stock is valued at $178.50 at 05:22 EST, below its 52-week high of $184.42 and way above its 52-week low of $96.61.
Omnicell's Moving Average
Omnicell's value is above its 50-day moving average of $164.42 and way higher than its 200-day moving average of $151.79.3. Mercer International (MERC)
12.7% sales growth and 3.99% return on equity
Mercer International Inc., together with its subsidiaries, manufactures and sells northern bleached softwood kraft (NBSK) pulp in Europe, the United States, Asia, and internationally.
Mercer International's sales growth this year is expected to be 24.4% and 4.5% for next year.
Year-on-year quarterly revenue growth grew by 17.8%, now sitting on 1.55B for the twelve trailing months.
Volume
Today's last reported volume for Mercer International is 169418 which is 46.42% below its average volume of 316238.
Mercer International's sales growth for the next quarter is 12.7%. The company's growth estimates for the current quarter and the next is 600% and 415%. The company's return on equity, which measures the profitability of a business relative to shareholder's equity, for the twelve trailing months is 3.99%.
Volatility
Mercer International's last day, last week, and last month's current intraday variation average was 0.36%, 1.93%, and 1.94%, respectively.
Mercer International's highest amplitude of average volatility was 1.98% (day), 3.54% (last week), and 4.94% (last month), respectively.
Mercer International's Stock Yearly Top and Bottom Value
Mercer International's stock is valued at $11.18 at 05:22 EST, way under its 52-week high of $18.14 and way above its 52-week low of $6.98.
Mercer International's Moving Average
Mercer International's worth is above its 50-day moving average of $11.06 and below its 200-day moving average of $12.41.Previous days news about Mercer International(MERC)
- Mercer international inc. to present at upcoming bofa securities 2021 virtual leveraged finance conference. According to Benzinga on Tuesday, 16 November, "NEW YORK, Nov. 16, 2021 (GLOBE NEWSWIRE) -- Mercer International Inc. (NASDAQ:MERC) today announced that David M. Gandossi, President and CEO, will be presenting at the following upcoming conference:", "At Mercer International Inc., we are exceptional people creating bioproducts for a more sustainable world. "
4. Huntsman Corporation (HUN)
9.3% sales growth and 23.65% return on equity
Huntsman Corporation manufactures and sells differentiated organic chemical products worldwide.
Huntsman Corporation's sales growth this year is anticipated to be 37.5% and 3.6% for next year.
Year-on-year quarterly revenue growth grew by 51.3%, now sitting on 7.81B for the twelve trailing months.
Volume
Today's last reported volume for Huntsman Corporation is 1468520 which is 40.47% below its average volume of 2467140.
Huntsman Corporation's sales growth for the next quarter is 9.3%. The company's growth estimates for the ongoing quarter and the next is 76.5% and 22.7%. The company's return on equity, which measures the profitability of a business relative to shareholder's equity, for the twelve trailing months is 23.65%.
Volatility
Huntsman Corporation's last day, last week, and last month's current intraday variation average was 1.44%, 1.08%, and 1.15%, respectively.
Huntsman Corporation's highest amplitude of average volatility was 2.32% (day), 2.20% (last week), and 2.13% (last month), respectively.
Huntsman Corporation's Stock Yearly Top and Bottom Value
Huntsman Corporation's stock is valued at $33.31 at 05:22 EST, below its 52-week high of $34.47 and way higher than its 52-week low of $24.10.