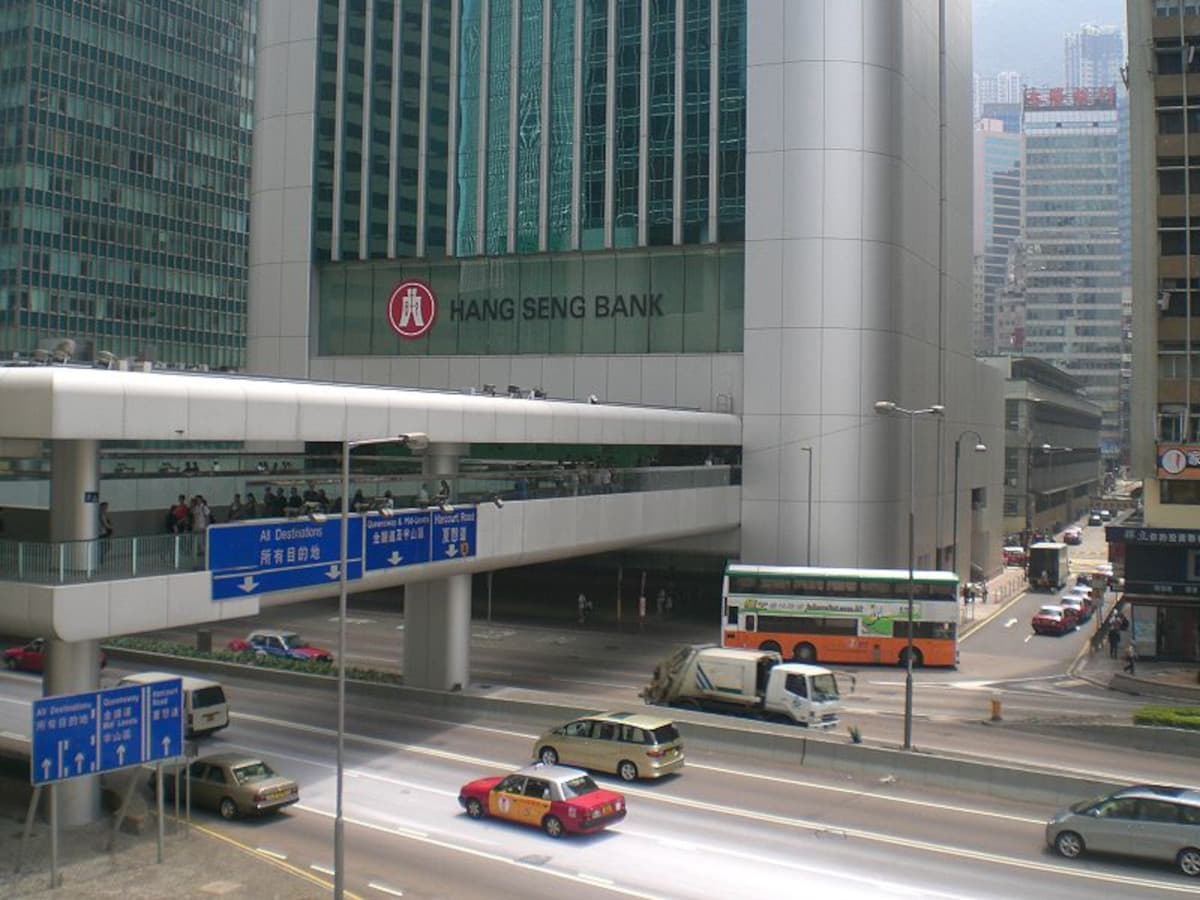
(VIANEWS) - HANG SENG INDEX (HSI) has been up by 5.46% for the last 5 sessions. At 21:08 EST on Thursday, 25 January, HANG SENG INDEX (HSI) is $16,145.11.
Concerning HANG SENG INDEX's yearly highs and lows, it's 9.13% up from its 52-week low and 28.88% down from its 52-week high.
Volatility
HANG SENG INDEX's last week, last month's, and last quarter's current intraday variation average was a positive 1.46%, a negative 0.04%, and a positive 1.28%, respectively.
HANG SENG INDEX's highest amplitude of average volatility was 2.62% (last week), 1.48% (last month), and 1.28% (last quarter), respectively.
Index Price Classification
According to the stochastic oscillator, a useful indicator of overbought and oversold conditions, HANG SENG INDEX's is considered to be oversold (<=20).
News about
- According to FXStreet on Wednesday, 24 January, "US equity indexes came in mixed on Wednesday with the Dow Jones Industrial Average (DJIA) shedding almost a hundred points while the NASDAQ 100 saw a boost from another tech sector ramp-up fueled by chipmakers, while the Standard & Poor's 500 (SP500) major index saw a thin gain into a fourth straight record close.", "The DJIA closed lower on Wednesday, shedding 99.06 points to close down 0.26% at $37,806.39 while the NASDAQ 100 climbed 55.97 points to close up 0.36% at $15,481.92."
More news about HANG SENG INDEX (HSI).

