(VIANEWS) – Chesapeake Granite Wash Trust (CHKR), Hawaiian Electric Industries (HE), Devon Energy (DVN) are the highest payout ratio stocks on this list.
We have congregated information concerning stocks with the highest payout ratio up to now. The payout ratio in itself isn’t a guarantee of good investment but it’s an indicator of whether dividends are being paid and how the company chooses to distribute them.
When researching a potential investment, the dividend payout ratio is a good statistic to know so here are a few stocks with an above 30% percent payout ratio.
1. Chesapeake Granite Wash Trust (CHKR)
100% Payout Ratio
Chesapeake Granite Wash Trust owns royalty interests in oil, natural gas liquids, and natural gas properties located in the Colony Granite Wash play in Washita County in the Anadarko Basin of Western Oklahoma. The company has royalty interests in 69 producing wells and 118 development wells, and in approximately 26,400 net acres of area. As of December 31, 2020, its reserve estimates for the royalty interests included 2,736 thousand barrels of oil equivalent of proved developed reserves. Chesapeake Granite Wash Trust was founded in 2011 and is based in Houston, Texas.
Earnings Per Share
As for profitability, Chesapeake Granite Wash Trust has a trailing twelve months EPS of $0.26.
PE Ratio
Chesapeake Granite Wash Trust has a trailing twelve months price to earnings ratio of 4.38. Meaning, the purchaser of the share is investing $4.38 for every dollar of annual earnings.
The company’s return on equity, which measures the profitability of a business relative to shareholder’s equity, for the twelve trailing months is 117.74%.
Earnings Before Interest, Taxes, Depreciation, and Amortization
Chesapeake Granite Wash Trust’s EBITDA is 11.3.
Volume
Today’s last reported volume for Chesapeake Granite Wash Trust is 7760 which is 87.29% below its average volume of 61060.
2. Hawaiian Electric Industries (HE)
63.76% Payout Ratio
Hawaiian Electric Industries, Inc., together with its subsidiaries, engages in the electric utility, banking, and renewable/sustainable infrastructure investment businesses in the state of Hawaii. It operates in three segments: Electric Utility, Bank, and Other. The Electric Utility segment engages in the production, purchase, transmission, distribution, and sale of electricity in the islands of Oahu, Hawaii, Maui, Lanai, and Molokai. Its renewable energy sources and potential sources include wind, solar, photovoltaic, geothermal, wave, hydroelectric, municipal waste, and other biofuels. This segment serves suburban communities, resorts, the United States armed forces installations, and agricultural operations. The Bank segment operates a community bank that offers banking and other financial services to consumers and businesses, including savings and checking accounts; and loans comprising residential and commercial real estate, residential mortgage, construction and development, multifamily residential and commercial real estate, consumer, and commercial loans. This segment operates 42 branches, including 29 branches in Oahu, 6 branches in Maui, 4 branches in Hawaii, 2 branches in Kauai, and 1 branch in Molokai. The Other segment invests in non-regulated renewable energy and sustainable infrastructure in the State of Hawaii. Hawaiian Electric Industries Inc. was incorporated in 1891 and is headquartered in Honolulu, Hawaii.
Earnings Per Share
As for profitability, Hawaiian Electric Industries has a trailing twelve months EPS of $1.81.
PE Ratio
Hawaiian Electric Industries has a trailing twelve months price to earnings ratio of 20.9. Meaning, the purchaser of the share is investing $20.9 for every dollar of annual earnings.
The company’s return on equity, which measures the profitability of a business relative to shareholder’s equity, for the twelve trailing months is 10.33%.
3. Devon Energy (DVN)
48.95% Payout Ratio
Devon Energy Corporation, an independent energy company, primarily engages in the exploration, development, and production of oil, natural gas, and natural gas liquids in the United States. It operates approximately 5,134 gross wells. Devon Energy Corporation was incorporated in 1971 and is headquartered in Oklahoma City, Oklahoma.
Earnings Per Share
As for profitability, Devon Energy has a trailing twelve months EPS of $9.12.
PE Ratio
Devon Energy has a trailing twelve months price to earnings ratio of 5.98. Meaning, the purchaser of the share is investing $5.98 for every dollar of annual earnings.
The company’s return on equity, which measures the profitability of a business relative to shareholder’s equity, for the twelve trailing months is 63.24%.
4. Canadian National Railway Company (CNI)
39.38% Payout Ratio
Canadian National Railway Company, together with its subsidiaries, engages in rail and related transportation business. The company offers rail services, which include equipment, custom brokage services, transloading and distribution, business development and real estate, and private car storage services; and intermodal services including temperature controlled cargo, port partnership, transloading and distribution, logistic parks, customs brokerage, trucking, and moving grains in containers. It also provides trucking services, such as door-to-door services, import and export dray, interline services, and specialized services comprising flatbed trucks, on-deck mobile transport trays, expedited and temperature controlled cargo, and permit/overweight services; and supply chain services. In addition, it serves automotive, coal, fertilizers, temperature controlled cargo, forest products, dimensional, grain, metal and minerals, petroleum and chemicals, and consumer goods applications. Further, the company operates a network of 20,000 route miles of track and shipping Canada and the United States. Canadian National Railway Company was incorporated in 1919 and is headquartered in Montreal, Canada.
Earnings Per Share
As for profitability, Canadian National Railway Company has a trailing twelve months EPS of $5.48.
PE Ratio
Canadian National Railway Company has a trailing twelve months price to earnings ratio of 22.13. Meaning, the purchaser of the share is investing $22.13 for every dollar of annual earnings.
The company’s return on equity, which measures the profitability of a business relative to shareholder’s equity, for the twelve trailing months is 23.2%.
Volume
Today’s last reported volume for Canadian National Railway Company is 553247 which is 48.64% below its average volume of 1077220.
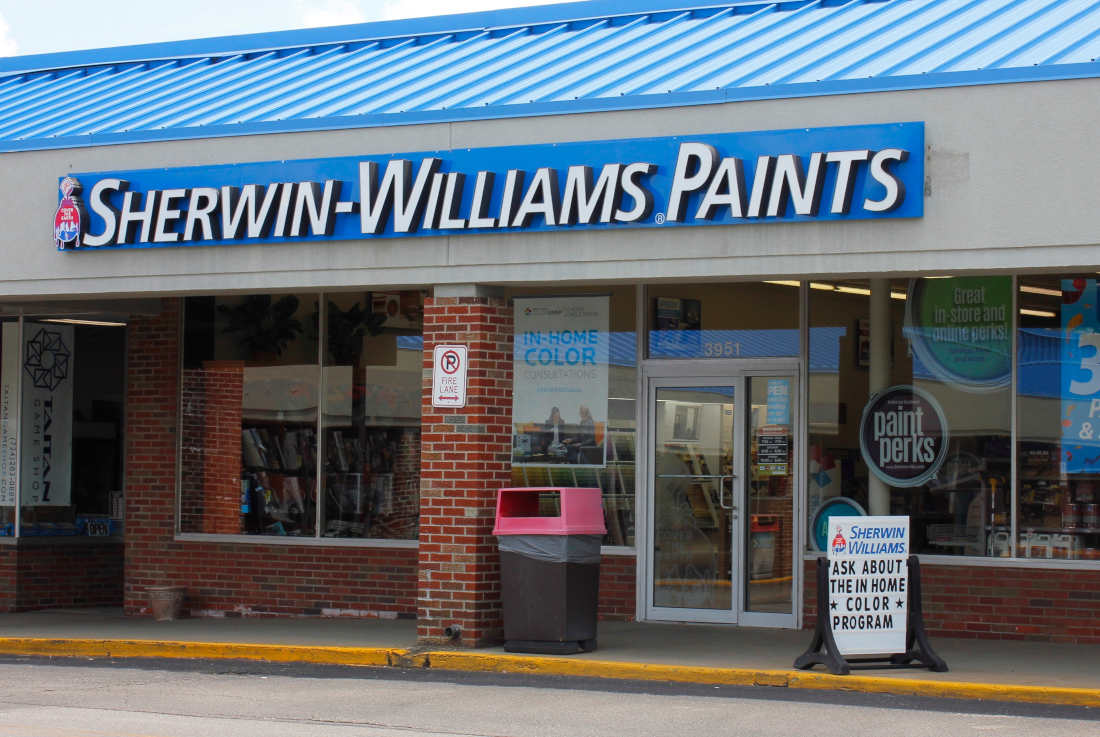
5. Sherwin (SHW)
31.09% Payout Ratio
The Sherwin-Williams Company develops, manufactures, distributes, and sells paints, coatings, and related products to professional, industrial, commercial, and retail customers. It operates through three segments: The Americas Group, Consumer Brands Group, and Performance Coatings Group. The Americas Group segment offers architectural paints and coatings, and protective and marine products, as well as OEM product finishes and related products for architectural and industrial paint contractors, and do-it-yourself homeowners. The Consumer Brands Group segment supplies a portfolio of branded and private-label architectural paints, stains, varnishes, industrial products, wood finishes products, wood preservatives, applicators, corrosion inhibitors, aerosols, caulks, and adhesives to retailers and distributors. The Performance Coatings Group segment develops and sells industrial coatings for wood finishing and general industrial applications, automotive refinish products, protective and marine coatings, coil coatings, packaging coatings, and performance-based resins and colorants. It serves retailers, dealers, jobbers, licensees, and other third-party distributors through its branches and direct sales staff, as well as through outside sales representatives. The company has operations primarily in the North and South America, the Caribbean, Europe, Asia, and Australia. As of February 17, 2022, it operated approximately 5,000 company-operated stores and facilities. The Sherwin-Williams Company was founded in 1866 and is headquartered in Cleveland, Ohio.
Earnings Per Share
As for profitability, Sherwin has a trailing twelve months EPS of $7.73.
PE Ratio
Sherwin has a trailing twelve months price to earnings ratio of 29.3. Meaning, the purchaser of the share is investing $29.3 for every dollar of annual earnings.
The company’s return on equity, which measures the profitability of a business relative to shareholder’s equity, for the twelve trailing months is 72.94%.
Yearly Top and Bottom Value
Sherwin’s stock is valued at $226.50 at 14:23 EST, way below its 52-week high of $285.00 and way above its 52-week low of $195.24.
6. Steven Madden, Ltd. (SHOO)
30.32% Payout Ratio
Steven Madden, Ltd. designs, sources, markets, and sells fashion-forward branded and private label footwear, accessories, and apparel for women, men, and children in the United States and internationally. Its Wholesale Footwear segment provides footwear under the Steve Madden, Steven by Steve Madden, Madden Girl, BB Dakota, Dolce Vita, DV Dolce Vita, Betsey Johnson, GREATS, Blondo, Anne Klein, Mad Love, Superga, Madden NYC, and COOL Planet brands, as well as private label footwear. The company's Wholesale Accessories/Apparel segment offers handbags, apparel, small leather goods, belts, soft accessories, fashion scarves, wraps, gifting, and other accessories under the Steve Madden, BB Dakota, Anne Klein, Betsey Johnson, Cejon, Madden NYC, and Dolce Vita brands, as well as private label handbag and accessories to department stores, mass merchants, off-price retailers, online retailers, specialty stores, and independent stores. Its Direct-to-Consumer segment operates Steve Madden and Superga full-price retail stores, Steve Madden outlet stores, and Steve Madden shop-in-shops, as well as digital e-commerce websites, including SteveMadden.com, DolceVita.com, betseyjohnson.com, Blondo.com, GREATS.com, and Superga-USA.com. The company's Licensing segment licenses its Steve Madden, Madden Girl, and Betsey Johnson trademarks. Its First Cost segment operates as a buying agent for footwear products under private labels for national chains, specialty retailers, and value-priced retailers. As of December 31, 2021, it owned and operated 214 brick-and-mortar retail stores that included 147 Steve Madden full-price stores, 66 Steve Madden outlet stores, and 1 Superga store, as well as 6 e-commerce websites. Steven Madden, Ltd. was incorporated in 1990 and is headquartered in Long Island City, New York.
Earnings Per Share
As for profitability, Steven Madden, Ltd. has a trailing twelve months EPS of $2.77.
PE Ratio
Steven Madden, Ltd. has a trailing twelve months price to earnings ratio of 12.67. Meaning, the purchaser of the share is investing $12.67 for every dollar of annual earnings.
The company’s return on equity, which measures the profitability of a business relative to shareholder’s equity, for the twelve trailing months is 26.1%.
Sales Growth
Steven Madden, Ltd.’s sales growth is negative 19.7% for the current quarter and negative 10% for the next.
Growth Estimates Quarters
The company’s growth estimates for the current quarter and the next is a negative 47.9% and a negative 14.5%, respectively.
Earnings Before Interest, Taxes, Depreciation, and Amortization
Steven Madden, Ltd.’s EBITDA is 54.58.


